D3 Band Scale
Using a band scale in D3 with scaleBand(). More about D3 Using Scales.
The D3 Docs have this great image to help visualize D3 scaleBand() methods:
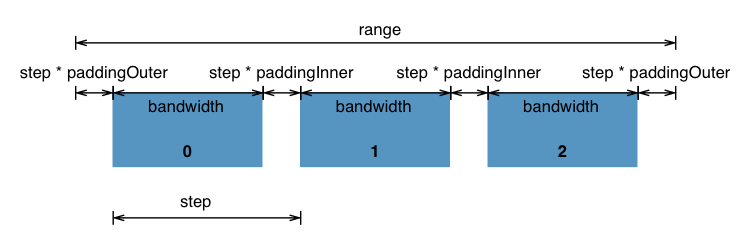
These are the methods available:
- .domain()
- .range()
- .rangeRound()
- .round()
- .paddingInner()
- .paddingOuter()
- .padding()
- .align()
- .bandwidth()
- .step()
Given this dataset:
year     population
1950        5
1951        10
1955        15
1959        20
Set the examples below with D3 Creating a Bar Chart
d3.scaleBand().domain()
The xScale is used to scale the year column. Instead of using it as a Date, it maps the range of the dataset length to a width range.:
xScale = d3.scaleBand()
           .domain(d3.range(dataset.length))
The domain .domain(d3.range(dataset.length)) is a range of dataset.length:
d3.range(dataset.length)
You can use the console.log() inside the CSV function to test:
d3.csv("file.csv", rowConverter).then(function(dataset) {
    console.log(dataset.length);
    console.log(d3.range(dataset.length));
    ...
The console should output this. See Setup D3 Step by Step:
4
Array(4) [ 0, 1, 2, 3 ]
The domain for scaleBand() is using this:
.domain([0, 1, 2, 3])
d3.scaleBand().range()
Setting the range to fit within the width of the SVG:
xScale = d3.scaleBand()
           .domain(d3.range(dataset.length))
           .range([0, w]);
The .range([0, w]) creates a range from [0, w], where the values are implicitly calculated with this formula:
(w - 0) / .domain().length
If the width was set to 500 then:
(w - 0) / .domain().length
(500 - 0) / 4 = 125
For a bar chart, this creates rectangles with the same width of 125.
So far we have this:
xScale = d3.scaleBand()
           .domain([0, 1, 2, 3])
           .range([0, 125, 250, 375])
d3.scaleBand().paddingInner()
The API docs say that if you don’t specify a paddingInner, the default is zero 0. If you specify one, the number must be <= 1. A value of 0 means there is no blank space between the bars. A value of 1 means a bandwidth of 0.
xScale = d3.scaleBand()
           .domain(d3.range(dataset.length))
           .range([0, w])
           .paddingInner(0.1);
d3.scaleBand().paddingOuter()
This is the padding to apply before the first bar and after the last bar. The number is in the range of [0, 1]. If not specified, the padding returns zero.
xScale = d3.scaleBand()
           .domain(d3.range(dataset.length))
           .range([0, w])
           .paddingInner(0.1)
           .paddingOuter(0.1);
d3.scaleBand().rangeRound()
The range can calculate long decimal numbers such as this:
<svg width="500" height="300">
    <rect x="12.195121951219477" y="205" width="122" height="55" fill="teal"></rect>
    <rect x="134.14634146341461" y="150" width="122" height="110" fill="teal"></rect>
    <rect x="256.0975609756098" y="95" width="122" height="165" fill="teal"></rect>
    <rect x="378.04878048780483" y="40" width="122" height="220" fill="teal"></rect>
</svg>
We can replace range with rangeRound.
xScale = d3.scaleBand()
           .domain(d3.range(dataset.length))
           .rangeRound([padding, w])
           .paddingInner(0.1)
           .paddingOuter(0.1);
The HTML now shows something like this:
<svg width="500" height="300">
    <rect x="14" y="205" width="122" height="55" fill="teal"></rect>
    <rect x="135" y="150" width="122" height="110" fill="teal"></rect>
    <rect x="256" y="95" width="122" height="165" fill="teal"></rect>
    <rect x="377" y="40" width="122" height="220" fill="teal"></rect>
</svg>
d3.scaleBand().bandwidth()
In a D3 bar chart, this used to return the width of each bar.