D3 Drawing SVG
Drawing an SVG in D3 to add HTML elements to a D3 visualization.
SVG stands for Scalable Vector Graphics. More info on Wikipedia. This is used to draw a canvas for adding HTML elements to a D3 visualization.
Create the SVG element with width w and height h:
var w = 500;
var h = 300;

var svg = d3.select("body")
            .append("svg");
            .attr("width", w)
            .attr("height", h);
See Setup D3 Step by Step to add this code to a project.js and run a Python server to see the output on the browser.
The HTML code shows that an svg tag was created:
<svg width="500" height="300"></svg>
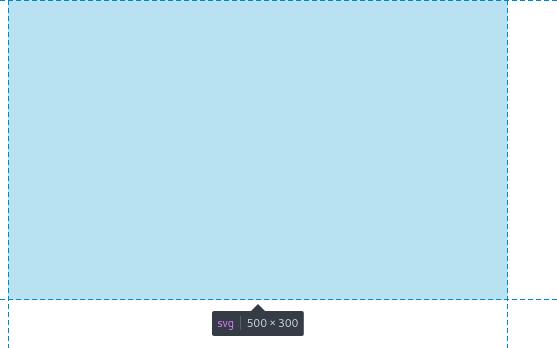
The SVG is visualized as a rectangle:

Next: D3 Creating a Bar Chart