D3 Creating a Bar Chart
In D3 creating a bar chart after loading a CSV file.
Using the CSV dataset:
year,population
1950,5
1951,10
1955,15
1959,20
Syntax to load a CSV file in D3
Use this syntax to load the CSV file. See D3 Load a CSV file with Promises. Passing the function rowConverter to convert strings to dates as seen in D3 Convert String to Date.
d3.csv("file.csv", rowConverter).then(function(dataset) {
    // add code here
});
SVG coordinates in D3
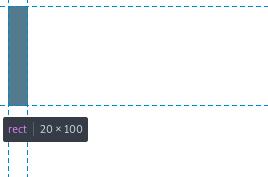
The rectangles of the bar chart are created by adding attributes for (x,y).
SVG coordinates are measured left to right and top to bottom. The coordinate (0,0) is the top left corner. The coordinates increase to the right for x and down for y.
xlocated at the bottom left of the rectangle.yat the top left of the rectangle.
You are drawing kind of upside down. That’s how weird SVG is.
Drawing each rectangle for the bar chart
In this example, width draws 20px to the right, and height draws 100px downwards from the y coordinate. All rectangles of the bar chart are drawn downwards, following the characteristics of the SVG having its (0,0) on the top left corner.
Add this to a project.js file. More details in Setup D3 Step by Step:
var w = 500;
var h = 300;
var barPadding = 3;
var padding = 40;
var svg = d3.select("body")
            .append("svg")
            .attr("width", w)
            .attr("height", h);

var parseTime = d3.timeParse("%Y");

var rowConverter = function(d) {
    return {
        year: parseTime(d.year),
        population: +d.population
    }
}

d3.csv("file.csv", rowConverter).then(function(dataset) {

    svg.selectAll("rect")
       .data(dataset)
       .enter()
       .append("rect")
       .attr("x", 0)
       .attr("y", 0)
       .attr("width", 20)
       .attr("height", 100);
});
Run the Python server to see the result and the HTML:
<svg width="500" height="300">
    <rect x="0" y="0" width="20" height="100"></rect>
    <rect x="0" y="0" width="20" height="100"></rect>
    <rect x="0" y="0" width="20" height="100"></rect>
    <rect x="0" y="0" width="20" height="100"></rect>
</svg>
However, by setting .attr("x", 0), it makes the bar chart rectangles to overlap on top of each other, as they are all drawn at the same (x, y) position.
Scaling the coordinates of the rectangles
The coordinates of the rectangles need to scale dynamically. For example for x values, use an anonymous function to pass each value d of the dataset, and the index i for each value. Then compute i times the width w over the length of the dataset.
Do the calculation by hand and you will understand how it works. Update the code to this and reload the browser:
var w = 500;
var h = 300;
var barPadding = 3;
var padding = 40;
var svg = d3.select("body")
            .append("svg")
            .attr("width", w)
            .attr("height", h);

var parseTime = d3.timeParse("%Y");

var rowConverter = function(d) {
    return {
        year: parseTime(d.year),
        population: +d.population
    }
}

d3.csv("file.csv", rowConverter).then(function(dataset) {

    svg.selectAll("rect")
        .data(dataset)
        .enter()
        .append("rect")
        .attr("x", function(d, i) {
            return i * (w/dataset.length);
            })
        .attr("y", function(d) {
            return h - d.population;
            })
        .attr("width", w/dataset.length - barPadding)
        .attr("height", function(d) {
            return d.population;
            })
        .attr("fill", "teal");

});
The result is this:
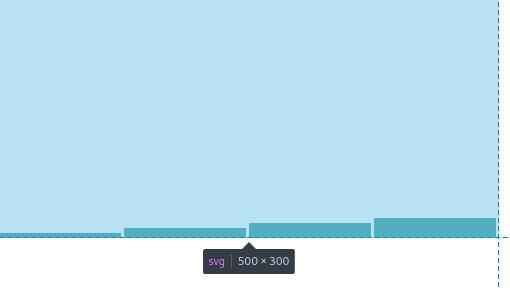
The HTML shows this:
<svg width="500" height="300">
    <rect x="0" y="295" width="122" height="5" fill="teal"></rect>
    <rect x="125" y="290" width="122" height="10" fill="teal"></rect>
    <rect x="250" y="285" width="122" height="15" fill="teal"></rect>
    <rect x="375" y="280" width="122" height="20" fill="teal"></rect>
</svg>
About this: attr("x", function(d, i)
We need to set the x position of each rectangle. This points to the bottom left of each rectangle.
attr("x", function(d, i) {
    return i * (w/dataset.length);
})
For each value of the dataset:
year     population
1950        5
1951        10
1955        15
1959        20
The corresponding x values are as follows. Keep in mind the d values are not used for the calculation, only the index (i) of each value. First, let’s look at the indices:
   d           i (index)
[1950, 5]       0
[1951, 10]      1
[1955, 15]      2
[1950, 20]      3
The calculation (w/dataset.length) is done to evenly position each rectangle across the width w of the SVG.
wwas set before asvar w = 500lengthof the dataset is4iis used to find a starting position for each rectangle.
The calculations of i * (w/dataset.length) are.
0 * (500/4)
1 * (500/4)
2 * (500/4)
3 * (500/4)
Then they are returned to the call back function as a parameter of each x attribute.
.attr("x", 0)
.attr("x", 125)
.attr("x", 250)
.attr("x", 375)
This means the first rectangle is positioned at x = 0, then second rectangle at x = 125 and so on.
About this: .attr("y", function(d)
We need to set the y position of each rectangle. This points to the top left of each rectangle.
.attr("y", function(d) {
    return h - d.population;
})
In this code h was previously set as var h = 300;.
The call back function is passing every row of the dataset as d and we need the second value population of each row to calculate the y coordinate of each rectangle.
return h - d.population;
Given these values, where a value of d corresponds to [d.year, d.population].
   d
[1950, 5]
[1951, 10]
[1955, 15]
[1950, 20]
The subtractions are:
300 - 5 = 295
300 - 10 = 290
300 - 15 = 285
300 - 20 = 280
For the SVG the (0,0) is at the top left. Then y value of 295 means measure 295px from top moving downwards.
These are returned to the call back function to form these:
.attr("y", 295)
.attr("y", 290)
.attr("y", 285)
.attr("y", 280)
Putting these two attributes together, we can get the coordinates for each rectangle
.attr("x", 0)        .attr("y", 295)
.attr("x", 125)        .attr("y", 290)
.attr("x", 250)        .attr("y", 285)
.attr("x", 375)        .attr("y", 280)
The rectangles are at these coordinates:
- Rectangle 1:
(0, 295) - Rectangle 2:
(125, 290) - Rectangle 3:
(250, 285) - Rectangle 4:
(375, 280)
About this: .attr("width", w/dataset.length - barPadding)
Now that we got the coordinates for each rectangle, then we need to draw them.
The .attr width, draws each rectangle from left to right.
We know that (w/dataset.length) = 500 / 4.
We are using a variable barPadding that we should have defined previously to make some separation between the rectangles.
var barPadding = 3;
The width is the same for all rectangles:
w/dataset.length - barPadding = 500/4 - 3 = 122
This value is then used as a parameter:
.attr("width", w/dataset.length - barPadding)
.attr("width", 122)
About this: .attr("height", function(d)
As seen here:
.attr("height", function(d) {
    return d.population;
})
Set the height starting from the position y by returning the value d.population on the dataset. In other words, build the rectangle downwards from top to bottom starting at position y.
Putting it all together using this format (x, width, y, height):
- Rectangle 1:
(0, 122, 295, 5) - Rectangle 2:
(125, 122, 290, 10) - Rectangle 3:
(250, 122, 285, 15) - Rectangle 4:
(375, 122, 280, 20)
Here is a description of the first two rectangles:
Rect1starts atx=0, drawwidth=122towards the right, at positiony=295, drawheight=5towards the bottom.- There is a
barPadding = 3towards the right, separating Rect1 from Rect2. Rect2startsx=125, drawwidth=122towards the right, at positiony=290, drawheight=10towards the bottom.
Keep in mind again the weird SVG way of positioning/drawing elements left to right, top to bottom.
Next: D3 Using Scales